3 Sep, 2018
Trade Plan for week of 9/3/2018
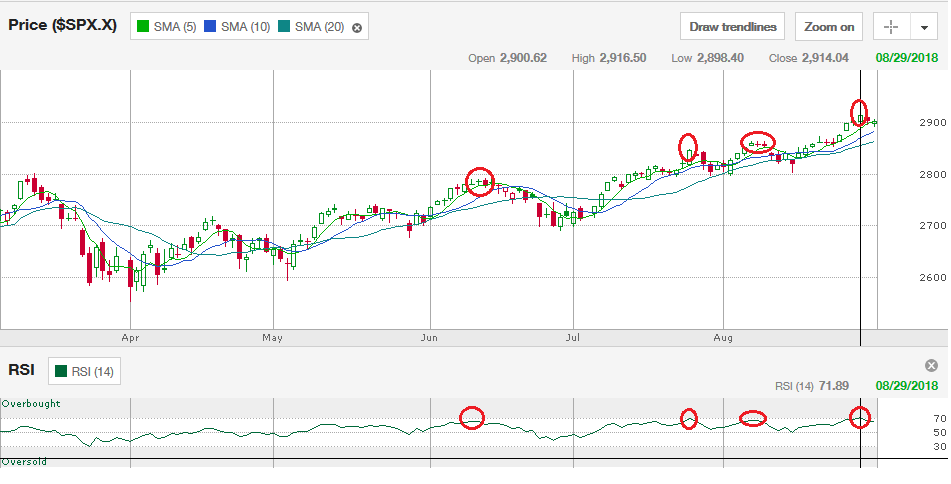
Short week this week! The S&P 500 feels “tired” this week but the QQQ looks like it isn’t slowing down. If you look at the chart below, you’ll see that the we are at 70 RSI on the weekly chart and this is typically a spot where we stall. The RSI (Relative Strength Index) is a momentum indicator and RSI > 70 is considered overbought. RSI < 30 is considered oversold. A lower RSI means that the stock isn't overextended. If the market is overextended, then this doesn't necessarily mean that we'll get a strong drop but maybe just a slowdown. We've been on a nice run so it's still possible that we'll see a green week.
This is kinda a hard market to trade in since you don’t want to be on a sidelines for a nice continued uptrend but sitting it out is way better than getting caught in the pullback.
With Biotechs on a run recently, I’m keeping an eye on IBB (Nasdaq Biotechnology ETF) and XBI (Small Biotechs ETF). XBI is at resistance and needs to break it’s recent high of $101.55. IBB has slowed down but could establish direction here soon…It looks similar to QQQ.
I want to see what happens Tuesday. If these biotechs begin to move up, I’m looking at CRSP and IDRA. I’m not convinced that I’ll take a trade this week since my rule is to be out by Friday!
Leave a Reply